New Social Media Insights for 2018
Business and Consumer Survey
How to create new Social Media Strategies from our Business and User Survey?
For quite some time now (2 months, 9 days, 14 hours and few hundred cups of coffee to be precise), we have been trying to come up with what makes Social Media tick in 2018. We tried everything from trying to get in touch with influencers and taking their opinions to watching episodes of Mad Men and hoping to get a brainwave but we weren't able to figure out this new Social Media.
However, the answer came in the form of an intern who devised this amazing survey which lead us talking to some amazing marketers in even more amazing firms, and users from across the planet for answering questions on Social Media. This lead us into creation of this infographic that can be used to assess how companies are factoring in Social Media in their overall Social Media strategies, and what the users actually use Social Media for.

What are the major insights from our Company and User Survey?
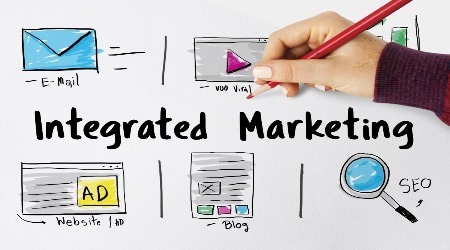
The companies havn't included Social Media in their IMC properly
Users want their brands to care about them and society
Users tend to be more accepting of the brands that tend to work towards the general good
Sign Up For Free To Get More InsightsMajor findings of our Survey
Current State of Social Media
As of 2015, the Social Media is at the peak in terms of overall reach and the impact that it can create in the grand scheme of things. There have been many historic movements that have happened because of the penetration of it. Few of the most prominent movements are The Arab Spring, Vigilante Hackers, London Riots, San Francisco BART riots, Occupy Wall Street and Nirbhaya Case. This has been possible due to the numbers that Social Media brings. At the end of the year 2017, Facebook had 2.2 active billion users, even after considering the fact that it is banned in many countries like Iraq, Syria and Iran, also including the highly populous China.

Apart from Facebook, Twitter has 327 million active monthly users, with 600 million tweets being sent every day across the planet. Instagram has taken over as the biggest photo sharing portal with 200 million active users and 60 million photos being posted every day. YouTube accounts for over 1 billion users with 6 billion hours of video watching every month. And on the professional front, LinkedIn connects over 500 million professionals across the planet.
Role of Social Media Marketing with the rising number of users
With the number of Social Media users rising, the companies can now no more look at simply creating a Social presence in the digital space. The companies need to get their social promotions right as it can be a double-edged sword. The right concept can make for an intriguing campaign that can potentially even rejuvenate a brand, like Old Spice’s “Smell like a man, man” featuring Isaiah Mustafa. However, the ones which are not carefully thought out will lead to a potential brand disaster, like JP Morgan’s “Snarkpocalypse”.
Keeping this in mind, 3 German scholars, Schulze, Scholer and Skiera did a research in 2014 at MIT Sloan Institute titled “Customizing Social Media Marketing”, on 751 Facebook marketing campaigns, especially involving Facebook, to decipher what prompts a consumer of the brand to share certain information about their campaign with their friends. The results revealed that there is no generally accepted formula that a marketer can follow to make a campaign successful. However certain broad parameters were defined that acknowledged what should be the potential questions that the marketing managers must answer. Few of them were to decide upon
- Whether they need to rely either on Reach or on Relevance
- Whether they want to target the first-degree friend list, or the second-degree contacts of the consumers
- Employing either a Push, or a Pull strategy
- Whether an incentive to use the product is involved or not
These 751 campaigns were in 22 product categories including games, entertainment, money and business. The overall results allowed the researchers to rule out the drivers of the campaign success.
Apart from these 3, American researcher Sean Gelles also provided KPIs for Social Media marketing which to an extent corroborate the research work done by the German, their research titled as “What are the KPIs for Brand Marketing in Social Media”. His 3 KPIs for the Brand Marketing done on the social platform are:
- Noticeability: This was noticed with the research done in the field of neuroscience, advertising and psychology, and suggests that the more consumers like an ad, the longer they tend to remember about the brand.
- Listening: Which is stated to be the key in understanding the demands of the potential customers and what types of visual and verbal content might capture their attention?
- Reach: This is the last KPI as it helps the marketers in determining on which platform(s) the campaign is best suited to run.
Also, according to a recent study, the consumers, especially the millennial generation (those who are born between 1985 and 2005) and women, are much more willing to go for a brand which is into Cause Marketing also known as Cause-Related Marketing in his research work titled “Achieving CRM through Cause Related Marketing”.
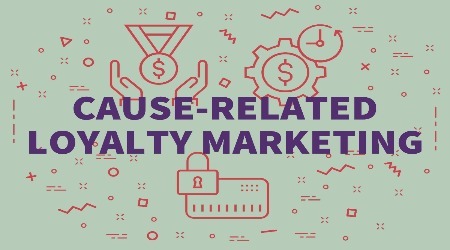
The partnership itself can be of 3 types: Transaction based promotions, Joint Promotions and Licensing. The partnership between a non-profit organization and a (for-profit) corporation has been able to deliver few of the biggest social media marketing campaigns. While American Express is the company which is held responsible for the first of its kind promotion when they trademarked the term in 1983, the recent examples of “Dawn saves wildlife” by Proctor and Gamble, “Super Love Sender” by Target, “lend a Paw” by Walmart and “Shiksha” by Proctor & Gamble (in India) are few of the biggest examples of Cause Marketing where the customers flocked towards a brand which provided them a reason to care for the said brand.
Methodology and Questionnaire Development
For completely understanding the impact of Social Media on the society, and how it impacts the typical IMC model, we had to do an analysis on both the companies as well as the users. In between both of them, there were several factors that need to be understood, that individually led to the development of the questionnaire for both of them.
How did we create the questionnaire for companies?
The questionnaire for the company focused on few factors that we were able to figure out using various studies conducted by Consultancy firms and by various outlines researched upon by Consulting firms. The overall development was to determine how seriously are the companies involving Social Media platforms in their Integrated Marketing Communication models going forward, if at all. This was done keeping in mind the following key aspects:
- The primary objectives that the companies possess when they decide to start their presence on a Social Media platform and the factors that are kept in mind before launching it, along with the preparations done
- The amount that is spent on Social Media and if they are deciding to create a separate individual team for it
- Whether or not, they are realising the importance of accessing Social Media through Smart Phones
- The key challenges that they realise that they would face when they start on a platform or the roadblocks that they may run into
- The amount of interaction that they have or plan to maintain with the users when they finally decide to be on a Social Media platform
- Are they going to launch a Social Media strategy, keep it as an exclusive team, or mix both of them?
- Also, if they intend to align the Social Media strategy with their business goals.
- What are the various drivers of the Social Media campaigns i.e., are they internally driven for betterment or are they lead by their competitors existing on Social Media?
- The average number of time and platforms that are taken into consideration before they launch a Social Media campaign.
- How do they integrate their various Social Media platforms with the other mediums of communication with the people? Do they advertise them through other channels, or let them grow organically?
- How do they measure impact of the Social Media platforms that they have been using or have started to use? Also, what are the various Business Metrics that they employ for such purposes?
These are the certain guidelines on the basis of which we created a set of 31 questions for the companies which was answered by 22 companies, including 3 IT Giants, 2 Big 4 Consulting firms, 2 E-Commerce firms, 5 Marketing Agencies, and 10 decently established start-ups with the Marketing spend being at least $100,000 a year. Following are the results of our research:

Social Media that the companies are using
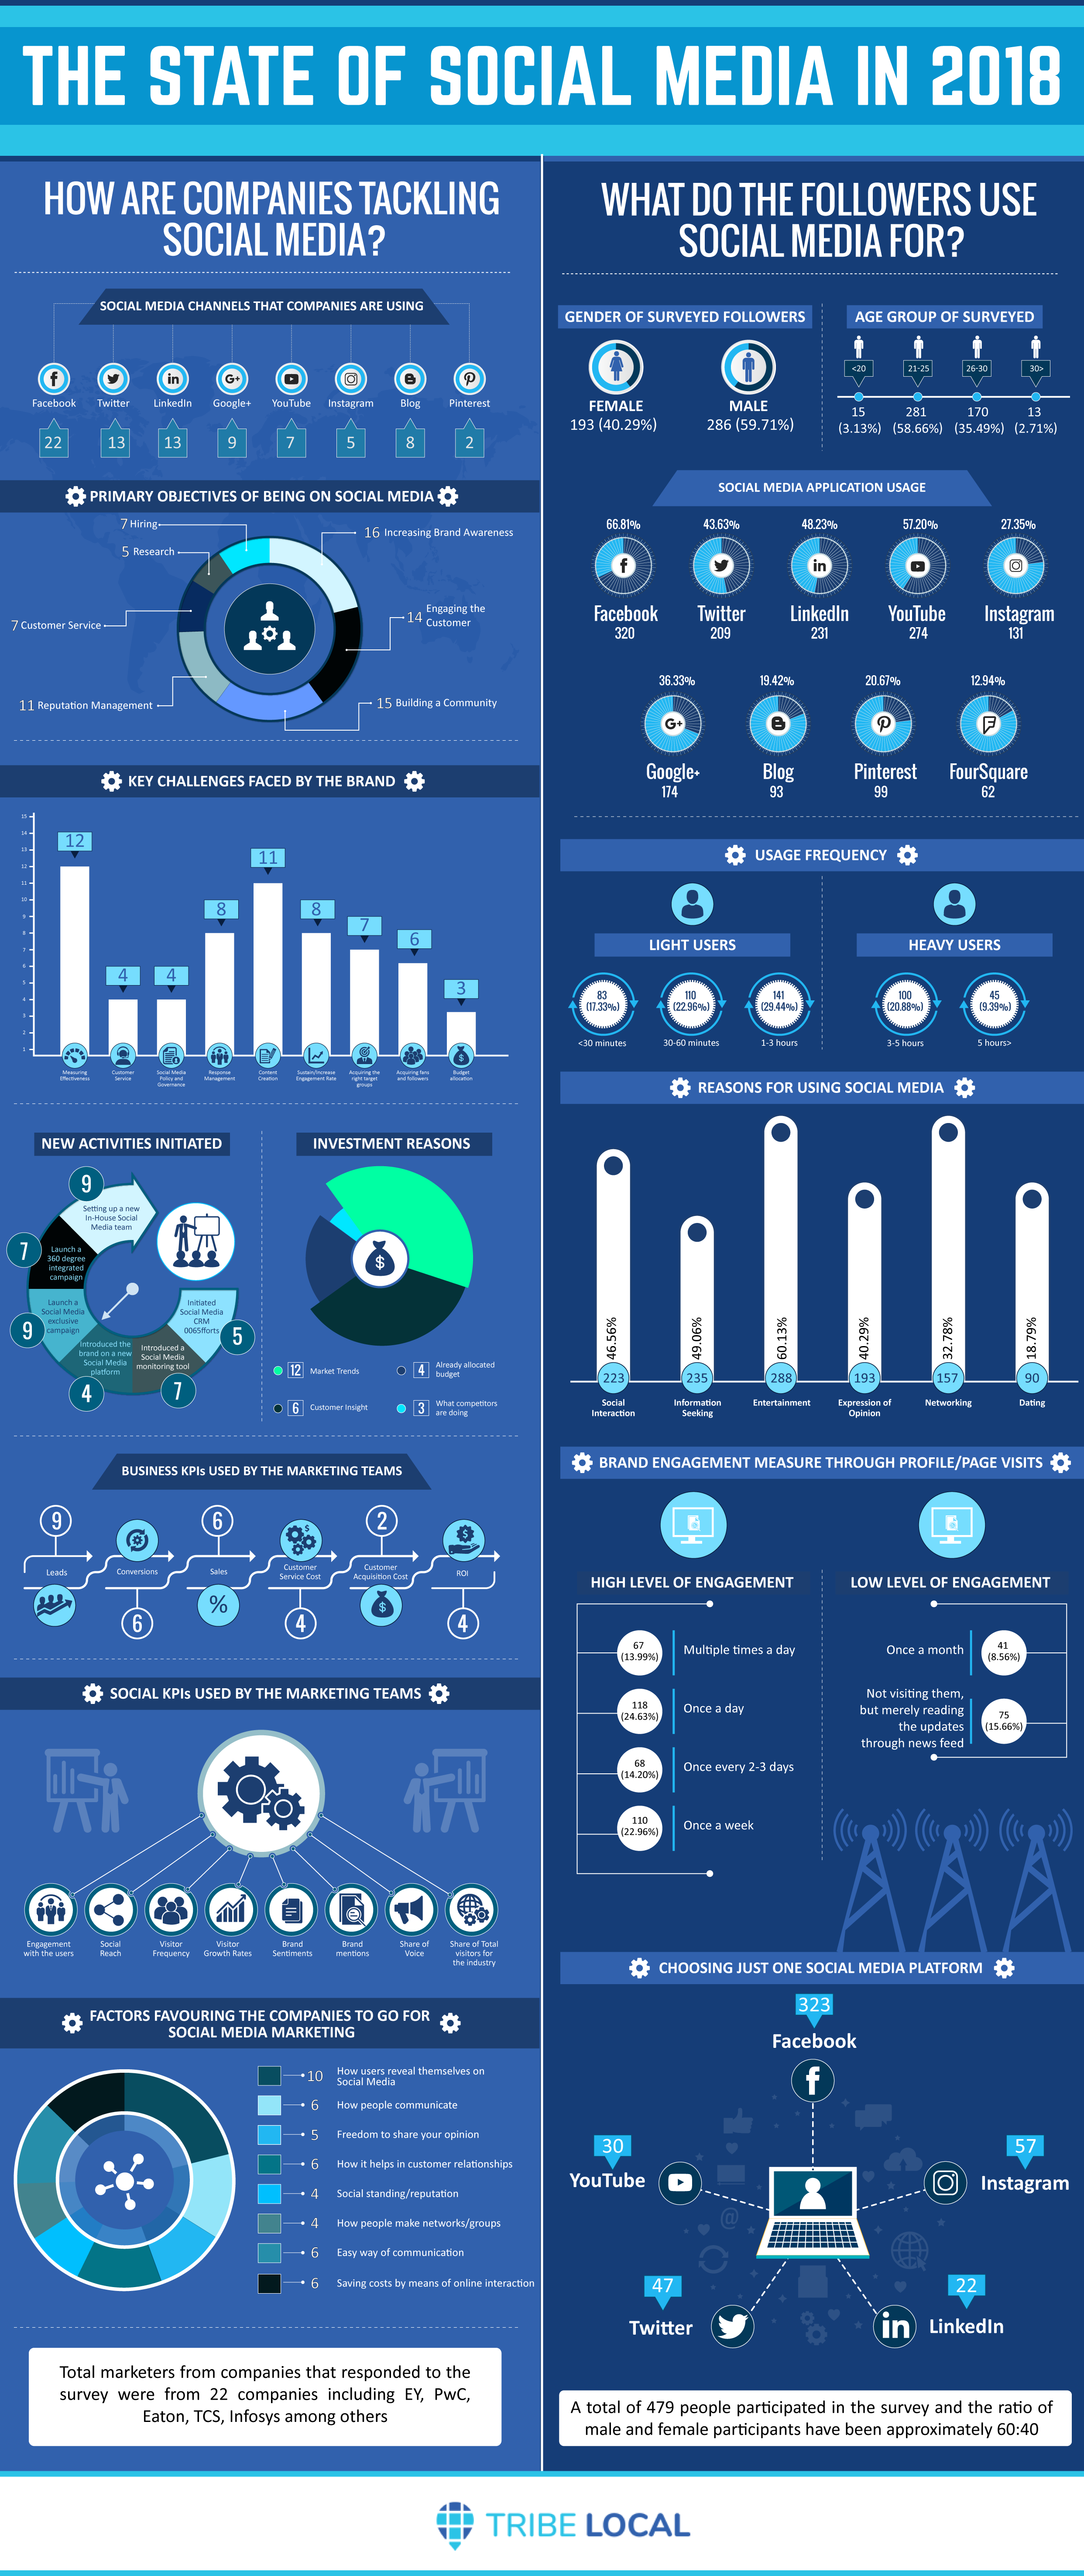
Under this criterion, all of the 22 companies surveyed responded to be using Facebook as social media platform. While both Twitter and LinkedIn are being used by the 13 companies, out the 22 surveyed. Nine companies acknowledged the use of YouTube, meanwhile 8 responded to be using Blog. Google+ and Instagram are being used by 7 and 5 companies respectively, out of the pool of 22. Pinterest got the minimum response as only 2 companies are using it.

Primary objectives of being on Social Media
For this criterion, 16 companies opted for ‘Increasing Brand Awareness’ as the primary reason. ‘Building a Community’ was recognized as an objective by 15 companies, while ‘Engaging the Customer’ was selected by 14 companies. ‘Reputation Management’ was chosen by 11 companies. ‘Customer Service’ and ‘Hiring’ both got acknowledged by 7 companies as primary objectives. Five companies responded in favour of ‘Research’ as an objective.

Key challenges faced by the brand
Under this, ‘Measuring Effectiveness’ got the maximum i.e. of 12 companies, followed by ‘Content Creation’ which was selected by 11 companies. Both ‘Response Management’ and ‘Sustain/Increase Engagement Rate’ were recognized as a challenge by 8 companies. Seven companies responded in favour of ‘Acquiring the right target groups’, whereas 6 companies identified ‘Acquiring fans and followers’ as a key challenge.

New activities initiated
Under this category, 9 companies selected both ‘Setting up a new In-House Social Media team’ and ‘Launch a Social Media exclusive campaign’. Whereas ‘Launch a 360-degree integrated campaign’ and ‘Introduced a Social Media monitoring tool’ were each recognized as new initiatives by 7 companies. ‘Initiated Social Media CRM efforts’ were acknowledged by 5 and ‘Introduced the brand on a new Social Media platform’ by 4 companies respectively.

Investment reasons
Under this criterion, ‘Market Trends’ occupy the greatest importance with 12 companies responding to it as an investment reason. ‘Customer Insight’ comes next with 6 companies opting in its favour. ‘Already allocated budget’ was recognized by 4 companies, while ‘What competitors are doing’ was selected by 3 companies.

Current Measurements
For this category, 11 companies responded positively for both ‘Engagement with the users’ and ‘Visitor Growth Rates’. ‘Visitor Frequency’ was selected by 8 companies as current measurements, whereas 6 companies opted for both ‘Social Reach’ and ‘Brand mentions’. ‘Brand Sentiments’ was acknowledged by 5 companies. And lastly, 3 companies recognized ‘Share of Voice’ and ‘Share of Total visitors for the industry’ as current measurements.

Business Metrics
Under this division, 9 companies opted to go for ‘Leads’ as a major Business Metric. Six companies went for ‘Conversions’ and ‘Sales’, whereas 4 companies each were in favour of ‘Customer Service Cost’ and ‘Return on Investment (ROI)’.

Factors favouring the companies to go for Social Media Marketing
Under this criterion, ‘How users reveal themselves on Social Media’ got the maximum selection with 10 companies opting for it. This is followed by ‘How people communicate’, ‘How it helps in customer relationships’ and ‘Saving costs by means of online interaction’ which are each acknowledged by 6 companies. ‘Freedom to share your opinion’ was selected by 5 companies. ‘Social standing/reputation’ and ‘How people make networks/groups’, both were recognized as factors by 4 companies.

How did we create the questionnaire for the users?
For the users, it became even more complicated when it was realised that the consumers may not view a particular Social Media campaign in the same light as the users that were probably being estimated by the companies. With that in mind, several constructs were utilised for defining the questionnaire on the basis of which the analysis has been done. The primary constructs of the model are:
- Information Quality: When a user decides to start following a company or brand on a Social Media platform, one of the key aspects that he looks towards is the quality of the information that the page/profile provides him. A lack of information or poor information may lead to an erosion of the user base which can be detrimental for the company.
- Product Related Learning: By following a brand on Social Media, a user wishes to know more about what he will get if they decide to follow the company. Part of this is determined the information of the products that he can use if he decides to purchase one from the company. Poor or insufficient learning can again be detrimental for the cause of the company.
-
Economic benefit: Although, not all companies will provide Economic Benefits, and all the customers are not expecting it either, but a chance of monetary or any other gains, is always going to boost the profile of the company, and certain offers may go viral as well.
Interactivity and Collaboration: Most of the basic mediums of advertising are a monologue, i.e. one-way conversations where the companies merely tell the user about their products. However, Social Media platforms act as a proper dialogue between the two, in which the users can extract the information they require and settle the doubts that may persist from the information that is already provided. - Social Presence: In this age of Social Media, mostly everyone longs to have a Social Presence where they are able to influence others with their own capabilities. The mass interactive points, that are the company’s pages and profiles, allow the users for establishing themselves as Thought Leaders experts which then lead to loyalty from such users.
- Entertainment: Lastly, while lack of entertainment is never harmful, its presence, like Economic benefit, greatly increases the value of the Social Media page or profile of the said company. Hence this is again a construct that needs to be kept in mind.

These are the said constructs on the basis of which we created our questionnaire for the users. A total of 479 respondents answered the questionnaire which were distributed in their age groups, mostly in the range of 20-30 years (351 respondents), which is the major user group for the various Social Media platforms. Also, a healthy percentage of Male: Female ratio was found (60:40 approximately), which allowed us realise that even though, the majority of the users are males, the number isn’t a huge imbalance, and may be corrected in the future.
Age
As the survey was conducted to understand the social media application usage among people, the participants were divided in various age groups based on tastes and preferences which change from being a student to being a professional.

Social Media Application Usage
To understand the social media application usage, the social media sites that were chosen were carefully selected so that it represents both leisure activities and professional interests including various hobbies like photography and writing. As the survey results show, Facebook is one of the most popular social media sites used followed closely by YouTube, LinkedIn and Twitter. The results also show the popularity and awareness of the various social media sites.

Usage Frequency
Once the usage was determined the next logical step was to understand the usage frequency. To understand the usage frequency the participants were divided into light users and heavy users. People who used social media for less than three hours were categorized as light users while people who used it for more than three hours were categorized as heavy users. The two categories were further subdivided to precisely understand the usage patterns among users. The results clearly show that light users form a majority of people who use social media.

Smart Phone Usage
Since smart phones these days form the major media through which people access social media sites, this criterion tries to capture people who mostly access social media through their phones. The usage frequency through smart phones was also divided into light and heavy users but here the division was based on the fraction of time the person uses mobile phone to access social media. People who access social media more than 50% of the time through smart phones were categorized as heavy users and the rest were categorized as light users and the survey clearly shows that there is shift towards using smart phones as the medium for accessing social media.

Reasons for using Social Media
The next criterion was to determine the reasons why social media is used. The survey shows that from a list of varied reasons the most coveted reason for using social media entertainment followed closely by spending leisure time, information seeking and social interaction which again corresponds to the earlier finding that the most popular social media sites are Facebook (spending leisure time and social interaction), YouTube (entertainment), LinkedIn (information seeking). The reasons for using social media along with the usage frequency and social media application usage also points towards the fact how effectively or ineffectively people use their time on social media.
Brand Engagement measure through profile/page visits
The next criterion was to understand the level of brand engagement through profile and page visits and to understand the same the users were again divided into high and low level of engagement. The brand engagement measure along with usage frequency gives an idea of how much time the average user spends on profile/page visits. An active user would visit maybe once or multiple times a day while a user with low level of engagement will visit maybe once a month or would only read the updates while not taking an active part in posting or sharing.

Choosing One Social Media Platform
Lastly to understand the most coveted social media platform the users were asked to choose one amongst the most popular ones and Facebook stands out a clear winner with 46.56% of the votes for the undisputed Social Media giant.

Conclusion
From the various questions that were asked from the Users and Companies perspective, there are certain factors the companies need to keep in mind for creating their Social Media campaigns. Few of the key analysis points that we have discovered would be crucial for determining how the companies can move forward in strategizing their Social Media marketing strategies.
Facebook is the primary platform that everyone is currently on, mainly due to the reach and popularity. However, Twitter and LinkedIn are currently catching up with it with the number of companies now realising the effectiveness of them. Also, companies realised that they need to introduce tools for measuring the Social Media campaigns as well as look into Customer Relationship Management through Social Media platforms. However, this may be hampered by the fact that the companies cite that they have pre-allocated budgets for their campaigns and teams.
Also, as mentioned by the companies, they are increasing measurements in terms of Social reach and Brand mentions for determining how effective their campaigns are. Also setting up the Business Metrics becomes an issue with most companies opting for Sales and Conversions. However as previously mentioned, the companies are hampered by their marketing budgets, as 50% of the companies have allocated budgets of less than 5% of the Social Media teams and a further 13% had a budget under 10%. This might change as a majority of the companies had an exclusive Social Media team, which might become a trend leading to higher budget allocations.
Lastly, to keep the interaction up, more than 55% of the companies posted at least once through their various Social Media platforms, and close to 54% of the companies responded to the customer enquiries within 3 hours. Also, 72% of the decisions are related to the Marketing department, with other departments making a sporadic appearance as per their requirements. The companies are also starting to use the Social Media platforms, not merely Linked, as hiring grounds for possible candidates for their companies.
We hope that this analysis proves to be useful for the companies in either drawing or looking back at their Social Media strategy and going back to the drawing board. It will help them in not only “converting” the customers, but making sure that they remain loyal to their brand because of what the company stands for rather than how good their marketing campaigns are.